Continental and country-level estimates
For a quick overview of the current fire situation please see these graphs showing cumulative emissions for this year and previous years for the GFED basis regions (see this map for definitions).
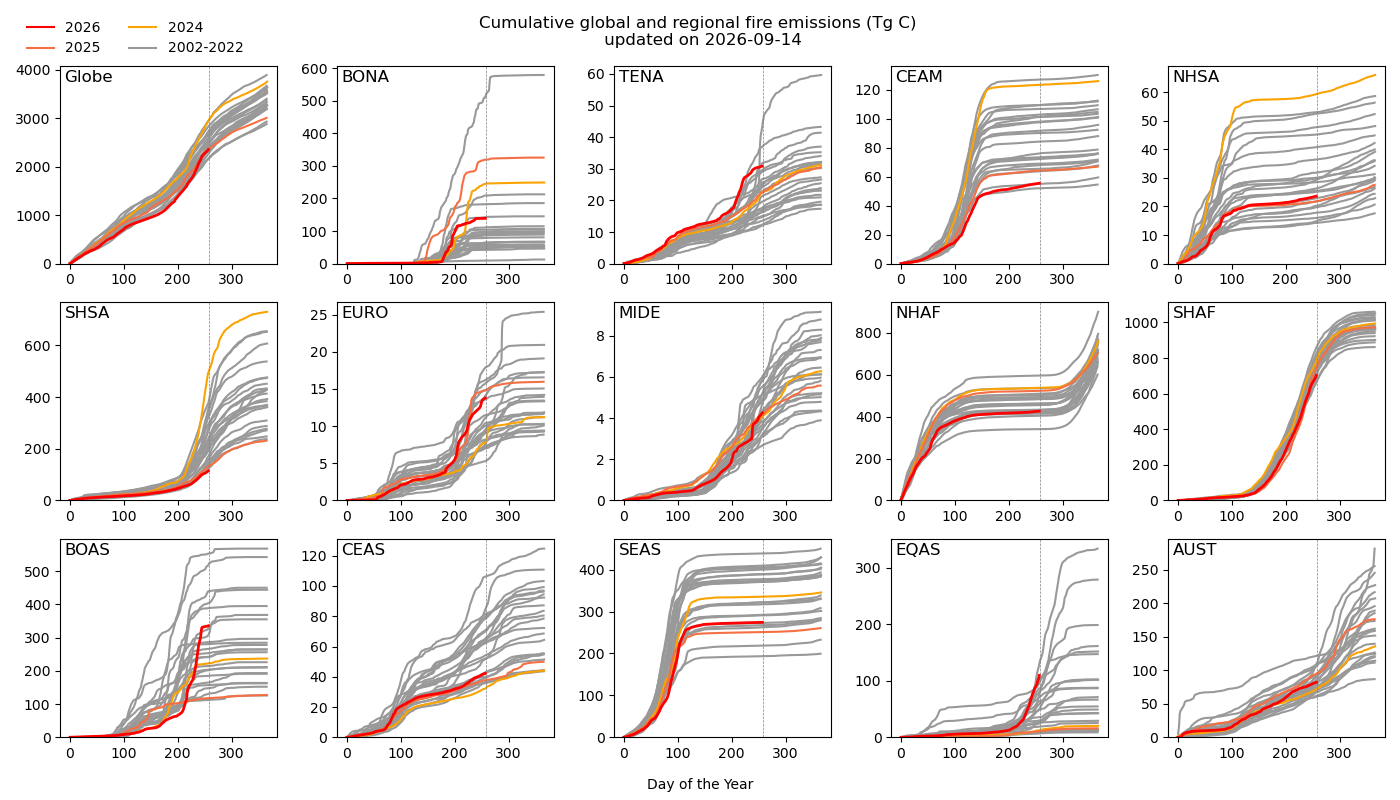
More detailed information on the current fire sitation for various regions can be derived using the dropdown menu below. You can choose between:
- GFED regions; 14 predefined regions, as in the overview figure above
- Continents; All continents except Antarctica
- Countries; countries covering more than sixteen 0.25° grid cells
- Custom; for example the global total, EU27, Legal Amazon, and Contiguous US
- Subnational; province, state, or island level data including state-level data for the US and Brazil, province-level data for Brazil and Indonesia, as well as for larger Indonesian islands
Additional information
GFED is built for large-scale applications and has a spatial resolution of 0.25°. This means the data is distributed in blocks of roughly 25 by 25 kilometer. As a result, inaccuracies may occur near national borders, where grid cells can overlap multiple countries. This is also the reason the country-level graphs are only given for larger countries, and do not contain the 1997-2000 years which had even coarser spatial resolution. Other things to keep in mind:
- The graphs contain all fire emissions, not only forest fires or wildfires
- Units are carbon emissions, CO2 emissions are 3.67 times those carbon emissions
- Emissions from fires cannot be directly compared with those from fossil fuel combustion; the latter are a net addition of CO2 to the atmopshere, always leading to climate change. In contrast, regrowth after fire often compensates for (part of) the direct fire emissions.