Related datasets and older GFED versions
Over the past decades we developed several datasets with information about global fire dynamics and emissions. Some are based directly on MODIS 500 meter data, including the Fire Atlas and a 500m version of GFED emissions. We also track and classify fires in the Amazon, mostly using VIIRS active fire detections. To provide historic biomass burning emissions we have merged several proxy datasets with GFED as an input dataset for CMIP model runs. Finally, there are older versions of GFED. These datasets are described in more detail below, please keep in mind that the 500m version of GFED and the historic dataset are inconstent with GFED5.
- Fire Atlas
- GFED 500m, a fire emission dataset with a 500m spatial resolution
- Amazon fire dashboard
- BB4CMIP, a fire emission dataset for the 1750-2020 period
- GFED4s
Fire Atlas
The Global Fire Atlas is a freely available global dataset that tracks the daily dynamics of individual fires to determine the timing and location of ignitions, fire size and duration, and daily expansion, fire line length, speed, and direction of spread. Data are available in easily accessible GIS-layers and can also be explored online here and a detailed description of the underlying methodology is provided by Andela et al. (2019).
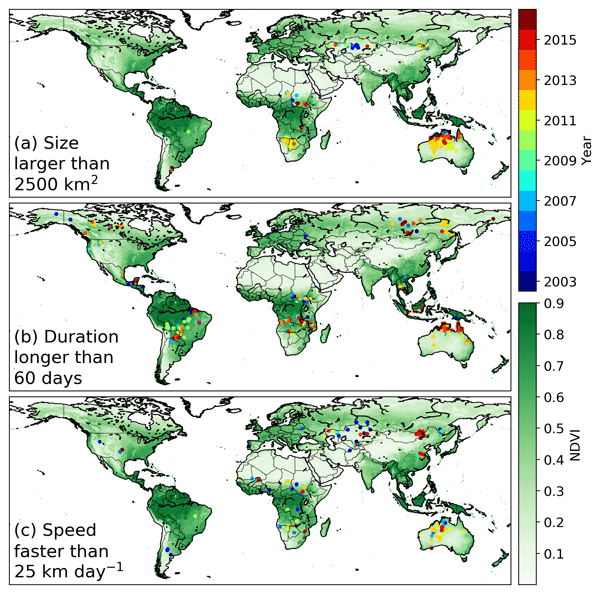
Location and year of the largest, longest, and fastest fires over the study period 2003-2016.
GFED 500-meter
Although the spatial resolution of GFED has increased over consecutive versions, it is still substantially coarser (now 0.25 degree) than the satellite data used (most at 500-meter). To bring the modeling and data resolution more in line we simplified the GFED model and ran it at 500-meter resolution for the 2002-2020 period. This dataset is described in Van Wees et al. (2022) .
The higher spatial resolution did not lead to substantial differences with GFED4s emission estimates (both 2.1 Pg C per year on a global scale), but it did make for a more thorough evaluation against field-measured fuel consumption. This resulted in somewhat higher fuel consumption estimates in the model, compensated for by somewhat lower burned area in the MCD64A1 C6 dataset compared to GFED4s. The fuel consumption estimates derived in this paper are the basis for the conversion of burned area to emissions in GFED5 which has substantially more burned area. Emissions from this datasets are therefore conservative but they are recommended for regional analyses where the increased spatial resolution is beneficial. Efforts are underway to expand the data to include the years 2021 and 2022.
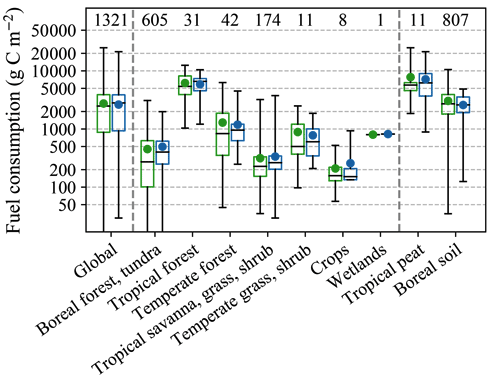
Comparison between modelled and measured fuel consumption (Figure 3 from Van Wees et al. (2022)).
Amazon fire dashboard
The Amazon Dashboard is based on a new near-real time methodology (Andela et al., 2022) to cluster satellite active fire detections into individual fire events, and classify each event as one of four different Amazon fire types. We differentiate deforestation fires, understory forest fires, small clearing or agricultural fires, and savanna and grassland fires. The algorithm tracks five metrics of fire behavior for each individual fire. These metrics of fire behavior are subsequently combined with information on land cover and historic deforestation within the fire perimeter to identify the specific fire type and confidence class (low, moderate, high) for each event. The dashboard can be accessed here.
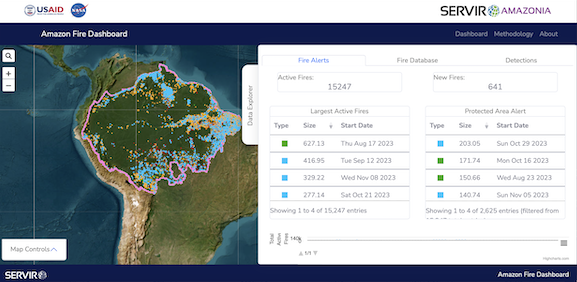
Screenshot of the Amazon fire dashboard.
Historic emissions (BB4CMIP)
Fire emissions from before the satellite era are uncertain, but proxy data and modeling can help in establishing variability and trends. In Van Marle et al. (2017) we have constructed a historic fire emissions dataset combining various sources of information for use in the Coupled Model Intercomparison Project Phase 6 (CMIP6). Please note that dataset was built using GFED4s as an anchorpoint and therefore conservative.
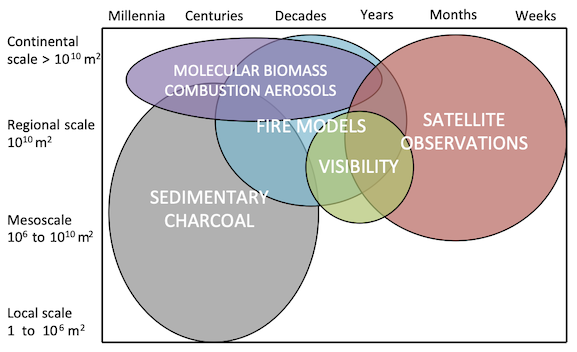
BB4CMIP is based on combining several datasets, each covering a specific time-space window (Figure 1 from Van Marle et al. (2017))
GFED4s
GFED4s was released in 2017 and described in van der Werf et al. (2017). It was the first GFED version that included small fire burned area, using a statistical methods firet described in Randerson et al. (2012). The data after 2016 is not based on burned area anymore due to a switch in MODIS burned area collections. GFED4s used collection 5.1 which was superceded by collection 6. Emissions for the post-2016 period are based on MODIS active fire detections and a grid-cell specific active fire to carbon emissions conversion based on the 2003-2016 overlapping period.
GFED4s data can be downloaded via SFTP, you can find here login details. GFED4s covers the 1997-2024 period and has a 0.25 degree spatial resolution.